Low Cycle Fatigue Testing Services
Metal components of a machine can fail when subjected to loads generating stresses well below the ultimate strength of the material; even below the yield strength. The mechanism for this phenomenon is the application of the load a very large number of times. Hence, such a failure is called a fatigue failure.
The design of a reliable machine demands a firm grasp of the number of times the load can be applied before failure occurs so that this number of cycles will not be exceeded in service. The consequences for such failures, which generally occur without warning, can be catastrophic. Manufacturers of machinery that demands the utmost in reliability, such as aircraft engines, spend considerable time and money into the consideration of fatigue in the design and subsequent testing of critical components.
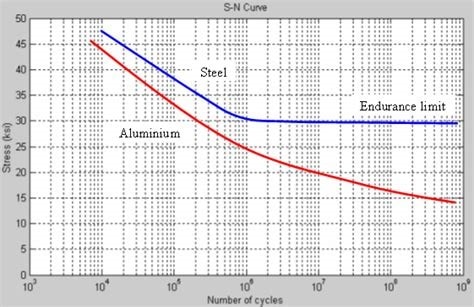
The importance of fatigue in the design of machinery is reflected in the effort that has gone into the development of guidelines for the fatigue life that can be expected for various metals as a function of the magnitude of the fluctuating stresses applied. This data is generally presented as a S-N curve which is merely a plot of cycles to failure against load. An example of a S-N curve is presented here.
Low Cycle Fatigue failure is caused by loads that result in stresses in excess of the yield strength of the material with failure generally occurring in the range of 104 to 105 cycles or fewer. If the loads do not result in yield, i.e., elastic deformation only, then the cycle counts to failure will be considerably higher; in the regime of High Cycle Fatigue. As can be seen in the S-N Curve, some materials, steel in particular, exhibit a threshold, known as the Endurance Limit, below which failure will never occur.
Now it is important to note that the actual life of a machined part may be significantly less than that presented in a S-N chart for the material due to parameters which, in addition to the strength of the material, influence the fatigue life. Thus, modifying factors must be applied for surface finish, stress concentrations, size and temperature among other characteristics of the application which affect the life. The best way to mitigate the uncertainty of the life that will be realized in service of a critical part is actually testing it under conditions which duplicate those which will be seen in service.
For rotating parts, the best way to perform such testing is in a spin pit. Spin Pit LCF testing allows the manufacturer of a critical component to control the important test parameters to an extent generally not possible in the finished machine. Moreover, the testing can be more economically performed in a spin pit; particularly if the destruction of the product can be avoided. Components for which LCF testing is particularly important include:
• Jet Engine Rotors
• Electric Vehicle Motor Rotors
• Energy Storage Flywheels
Barbour Stockwell provides manufacturers of high-speed rotating machinery with the facilities to perform LCF testing with unmatched precision in speed control; as precise as +/- 1 rpm. Temperatures of the test articles can be precisely controlled as well; isothermally or with gradients. To simulate the mission of an engine, cyclic tests can be programmed with a number of target speeds and associated ramp rates and dwell times. Moreover, a multitude of cyclic tests so defined can be “chained” together to be repeated as many times and in whatever sequence desired.
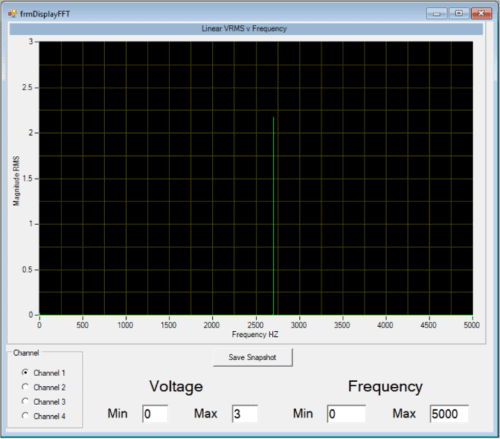
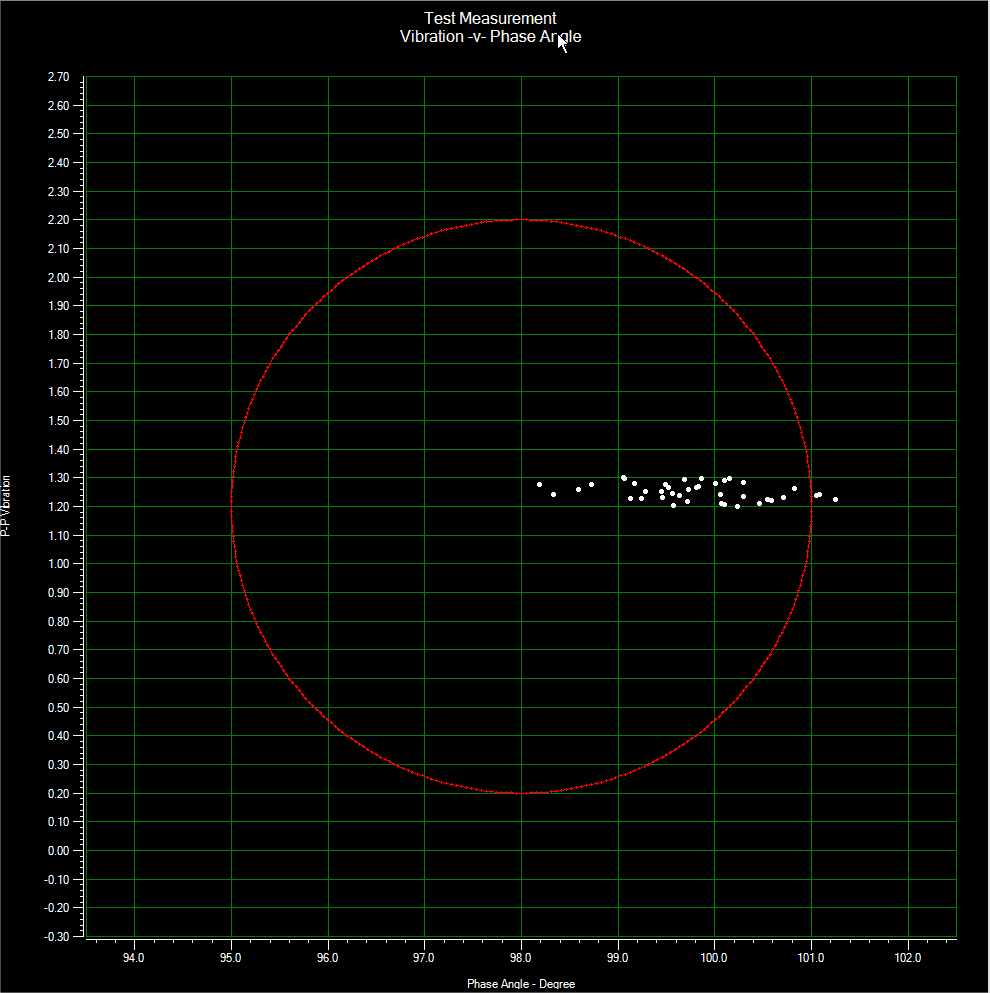
The manifestation of fatigue is presented in three phases; crack initiation, crack propagation and rupture. Barbour Stockwell has developed a crack detect system with proven technology that has shown to be the most effective means for detecting cracks while Spin Testing – boasting a greater than 90% detection rate. During such testing, the ability to detect the initiation of a crack is immensely valuable. You do not want the first manifestation of a crack to be a burst of the rotor. A burst will generally result in damage to the fracture surfaces adding an extra degree of difficulty to any forensic analyses. On top of that, a rotor burst will necessitate a somewhat costly and time consuming repair to the test facility.